What is Infographics?
Infographics are a set of visual presentations of ideas, data, or knowledge designed to educate readers by presenting graphic information on a particular subject. In other words, the infographic is a combination of information and graphic designs.
Most digital marketers commonly use infographics as one of the effective ways to do marketing strategy. It is also used by various bloggers, copy, and content writers to establish visual communication between the reader and the author.
Purpose of Infographics
Using infographics is the best way to deliver information with clear and detailed ideas to the readers. The usage of infographics became widely popular in the digital world from the past decades until in this modern era. It’s attractiveness, fun, colorful, and engaging feature helps easily keep the information and enhance comprehension.
- Marketing purposes – used by digital marketers, social media managers, copy, and content writers.
- Educational purposes – used by teachers, professors, lecturers, trainers, and educators.
- Instructional purposes – used in signages, newspapers, magazines, bulletin boards, etc.
- Nonprofit purposes – used in raising awareness in any social issue.
- Design purposes – used in website, blog posts, or app designs.
Different Types of Infographics
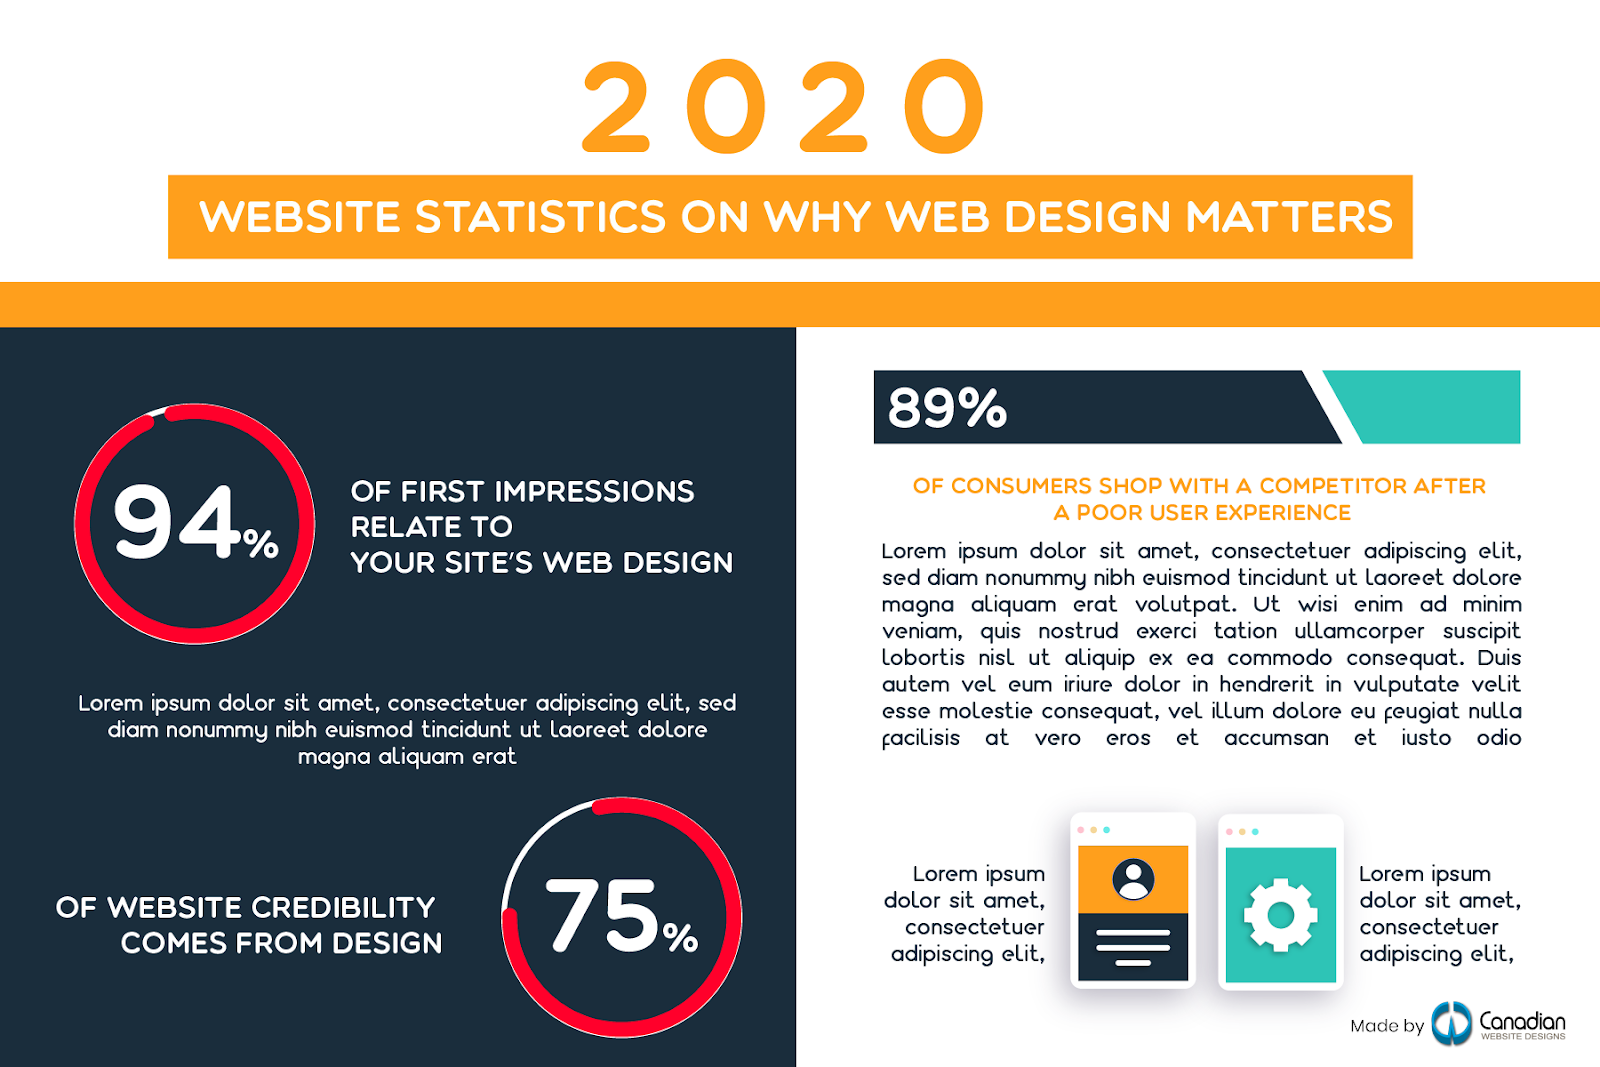
Statistical Infographic Presentation
It comprises statistical visual chart designs such as bar graphs, line graphs, histograms, pie charts, and other types of diagrams. This type of infographic was made for the presentation of the gathered data summary of survey results.
Informational Infographic Presentation
If you are a teacher or educational instructor, I recommend you to use informational infographic presentation; it enables your learners to adapt and keep the information easily. The nature of infographic structures like attractiveness and colorful appearance brings engagement to its readers.
Timeline Infographic Presentation
The visualization of history or biography is the best example of the proper usage of timeline infographics. This contains an organized date or a year from early to current, description, and relevant graphic images.

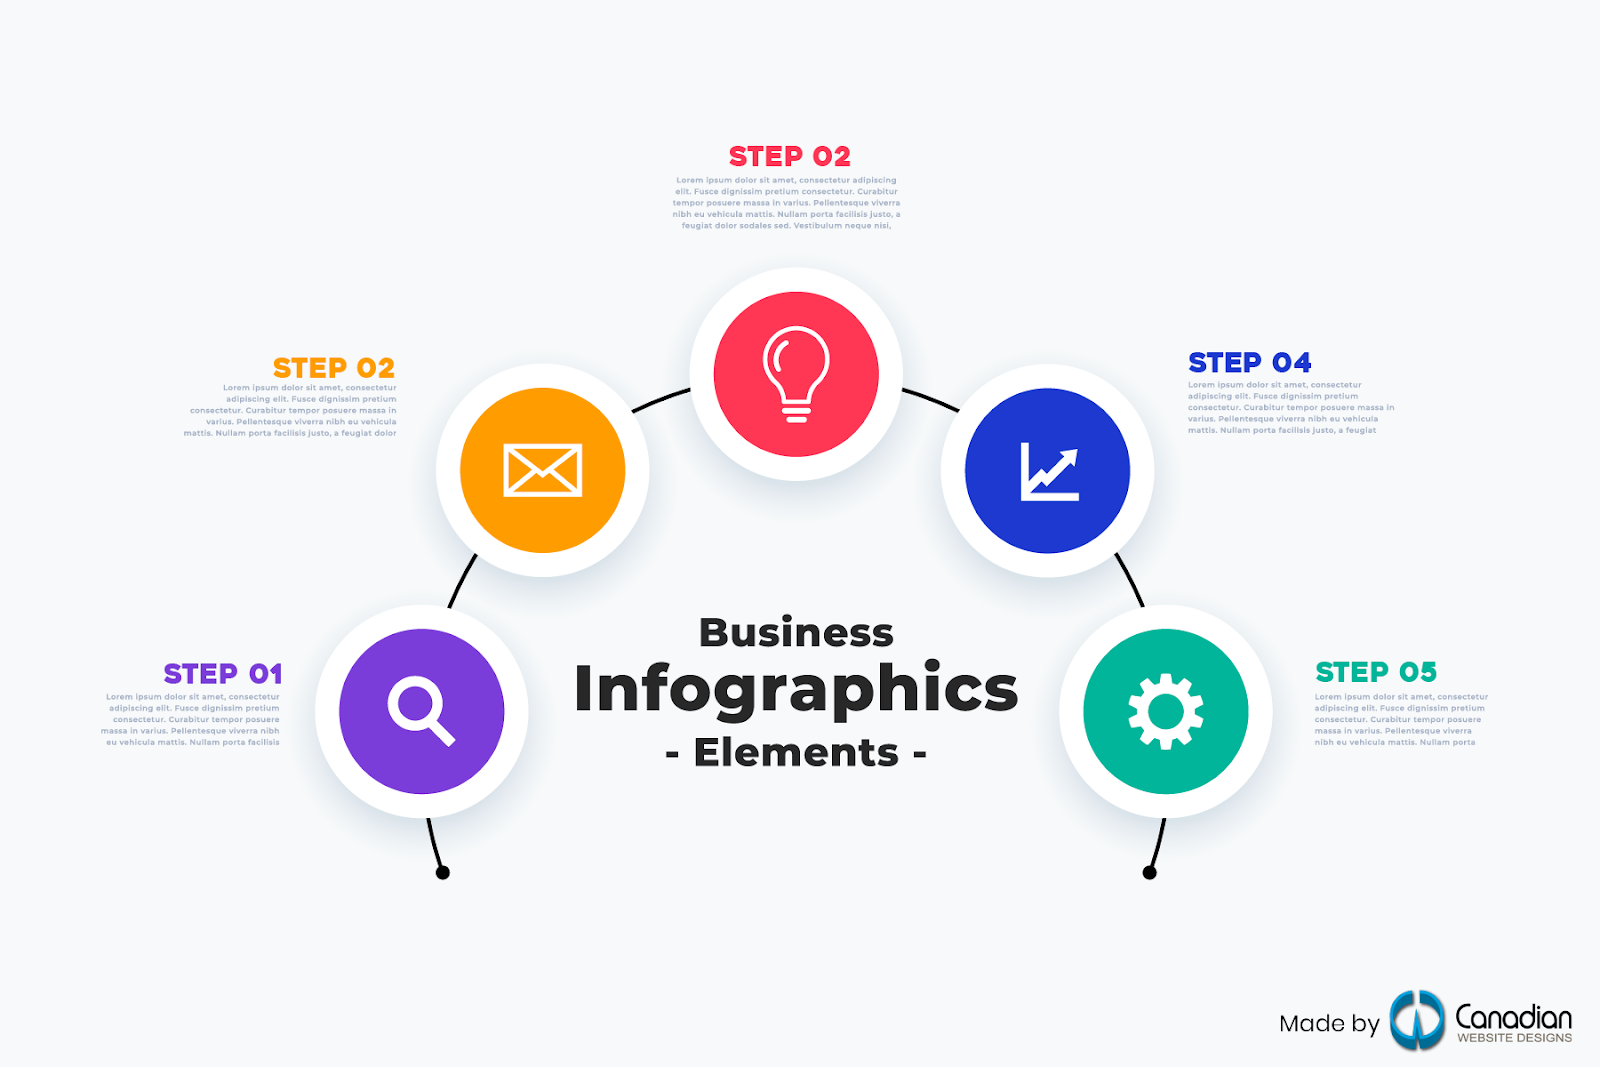
Process Infographic Presentation
Looking for the simplest way to give visual instructions without wasting your voice, the best idea would provide a process infographic. The common example of this is a how-to guide and step-by-step tutorials. They also use it in schools, public places, online markets, social media, and so on.
Geographic Infographic Presentation
This type of infographic presentation often features the place, city, or basically, a map. Sometimes, it functions as showing directions towards a place, showing the population, or displaying included city in a particular country.

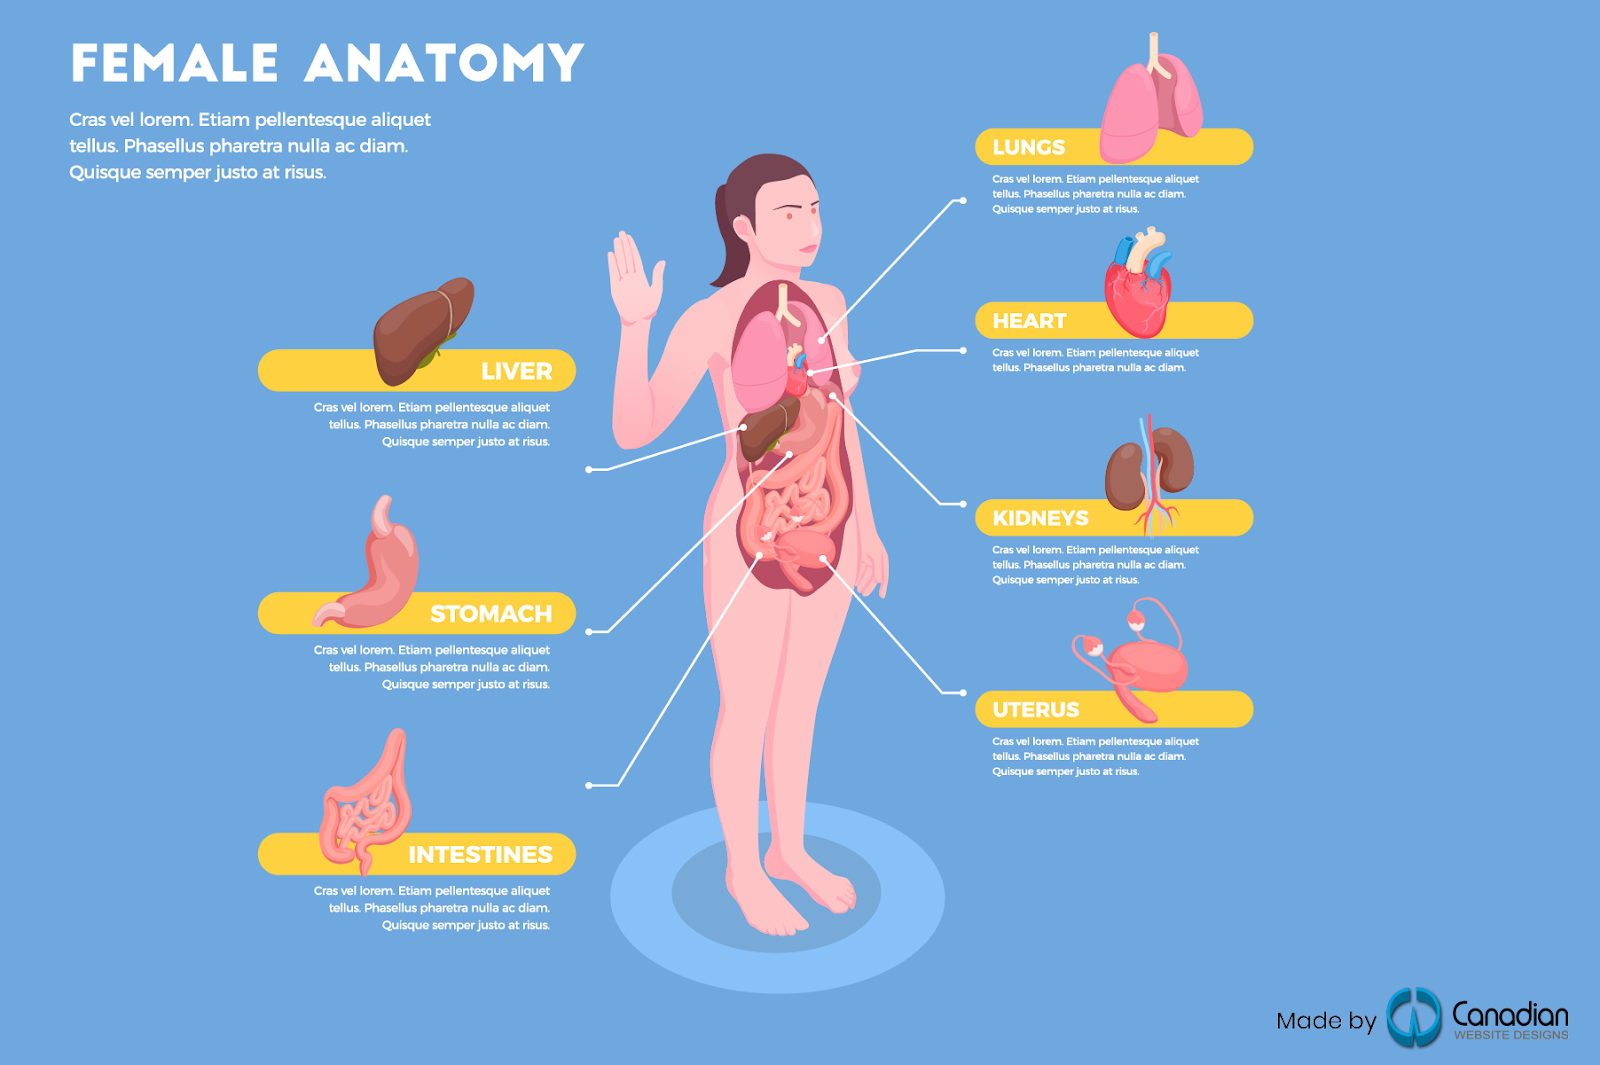
Anatomical Infographic Presentation
The most common example of anatomical infographic presentation is illustrating the human body parts. It contains the name of parts of the human body and the description or its function. This type of infographic presentation is suitable for educational purposes, enabling young learners to visualize and understand.
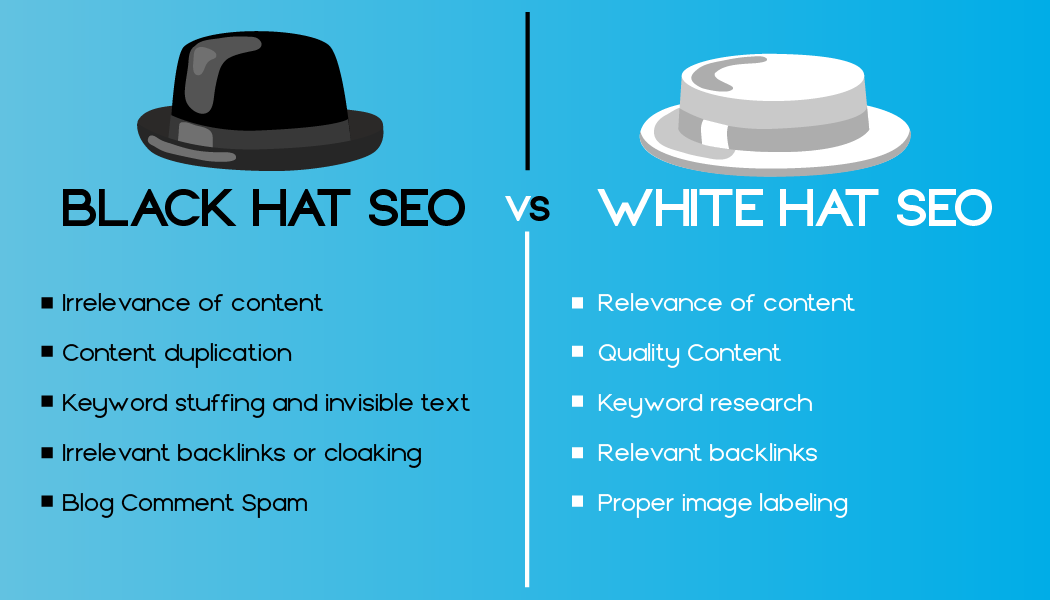
Comparison Infographic Presentation
When you want to present the difference between the two subjects in leadership training, like being a leader and a boss, for example, comparison infographic presentation is the most applicable for your presentation needs. It tackles the contrary descriptions between the two. Widely used as “vs.” in common illustrations.
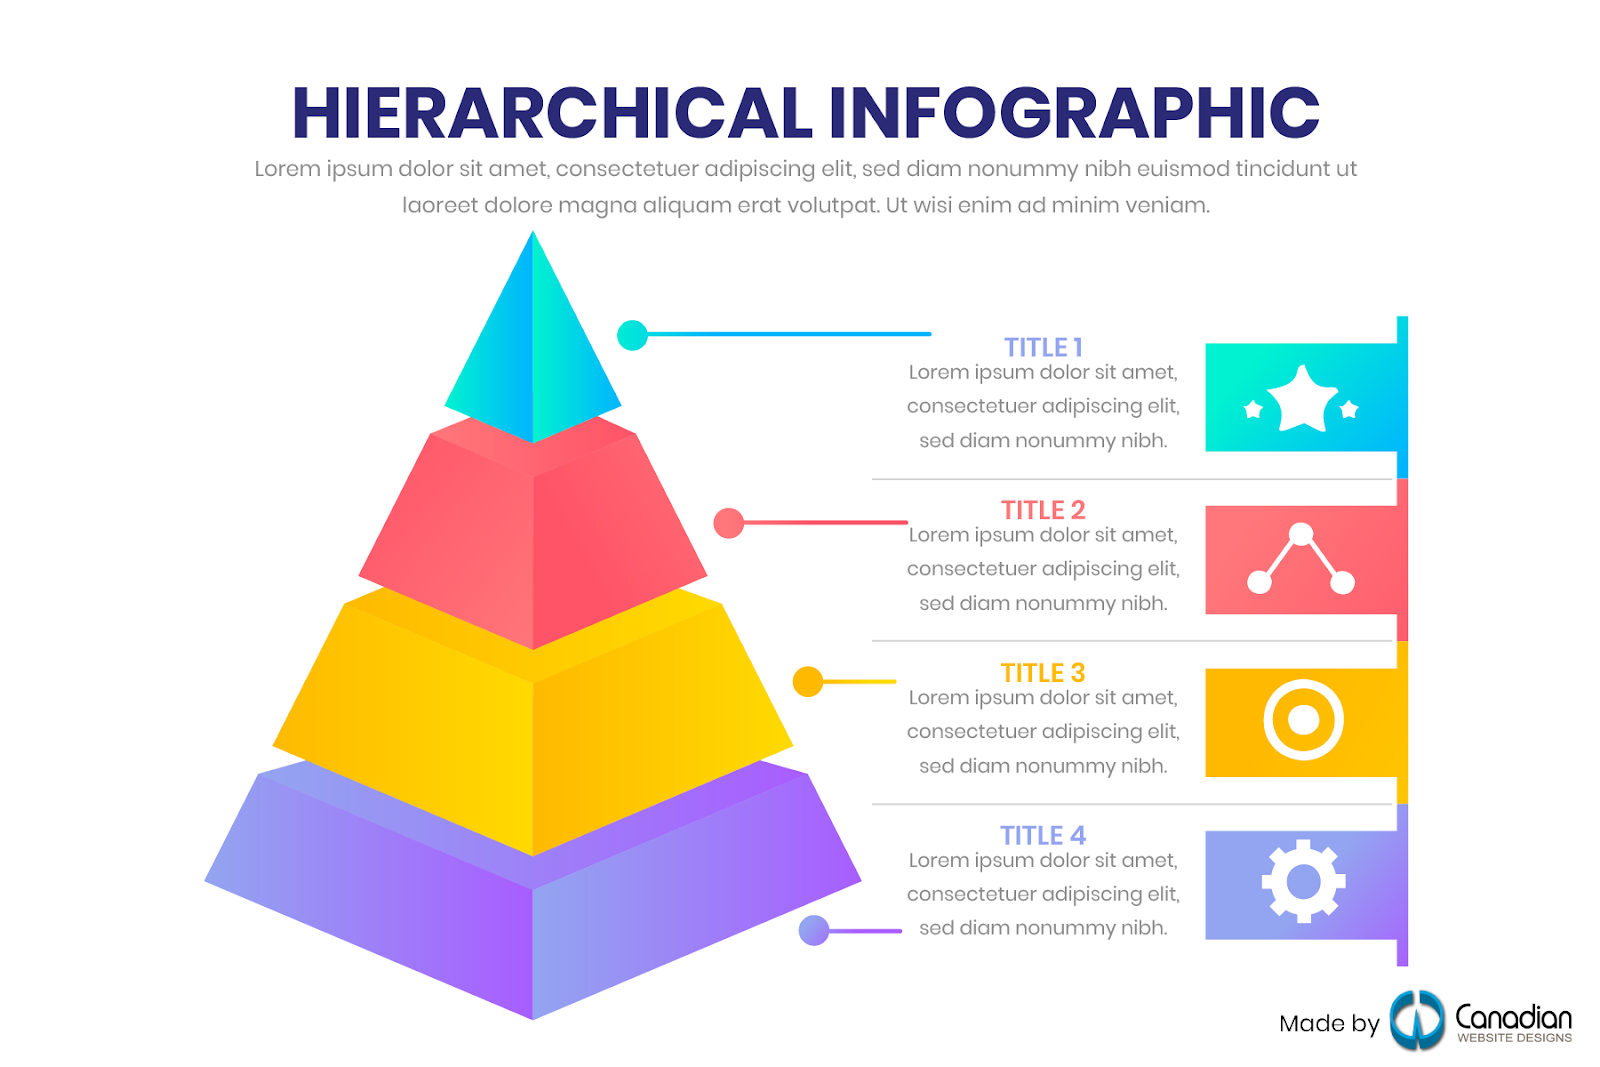
Hierarchical Infographic Presentation
Are you familiar with Abraham Maslow’s hierarchical needs? The popular reverse triangle presentation is a common example of a hierarchical infographic. This technique of visualization contains the organized idea or information per each level from the bottom to the top or vice versa. Aside from pyramid charts, another best sample is the iceberg presentation.
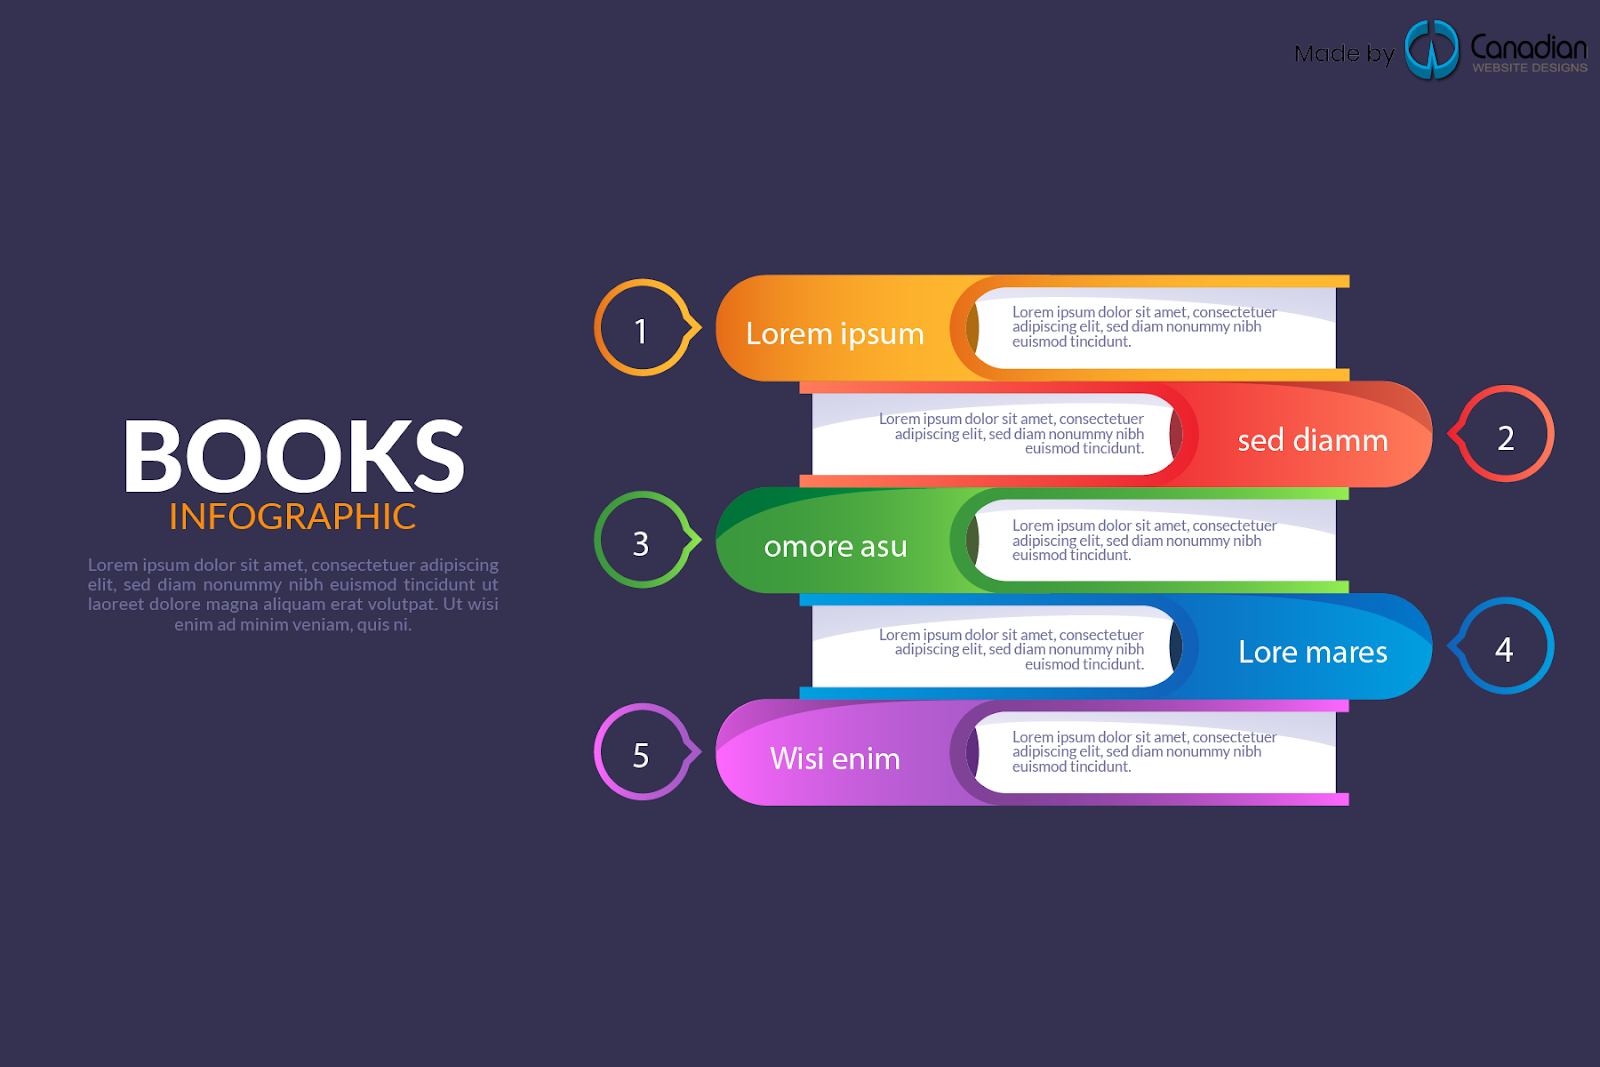
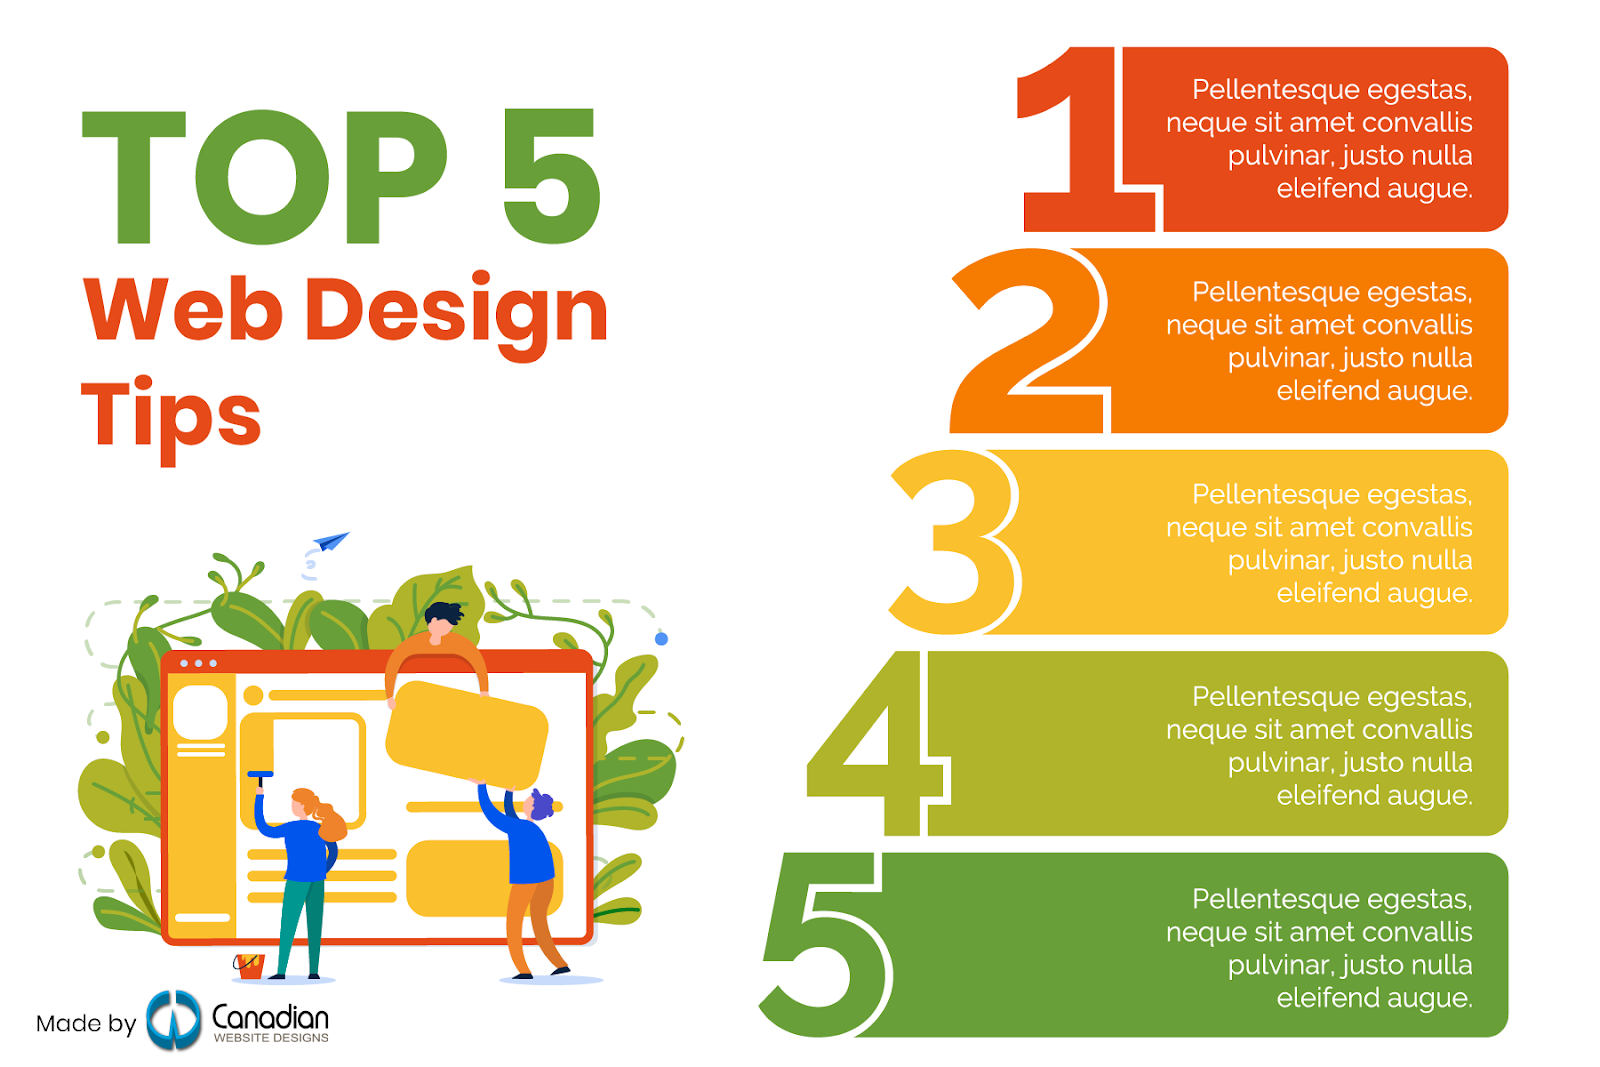
List Infographic Presentation
Basically, it composed of a simple numbered or bulleted list of information accompanied by images and other graphic designs. It is both used for educational and corporal presentation purposes. You can also see them in public and online for informing or marketing intentions.
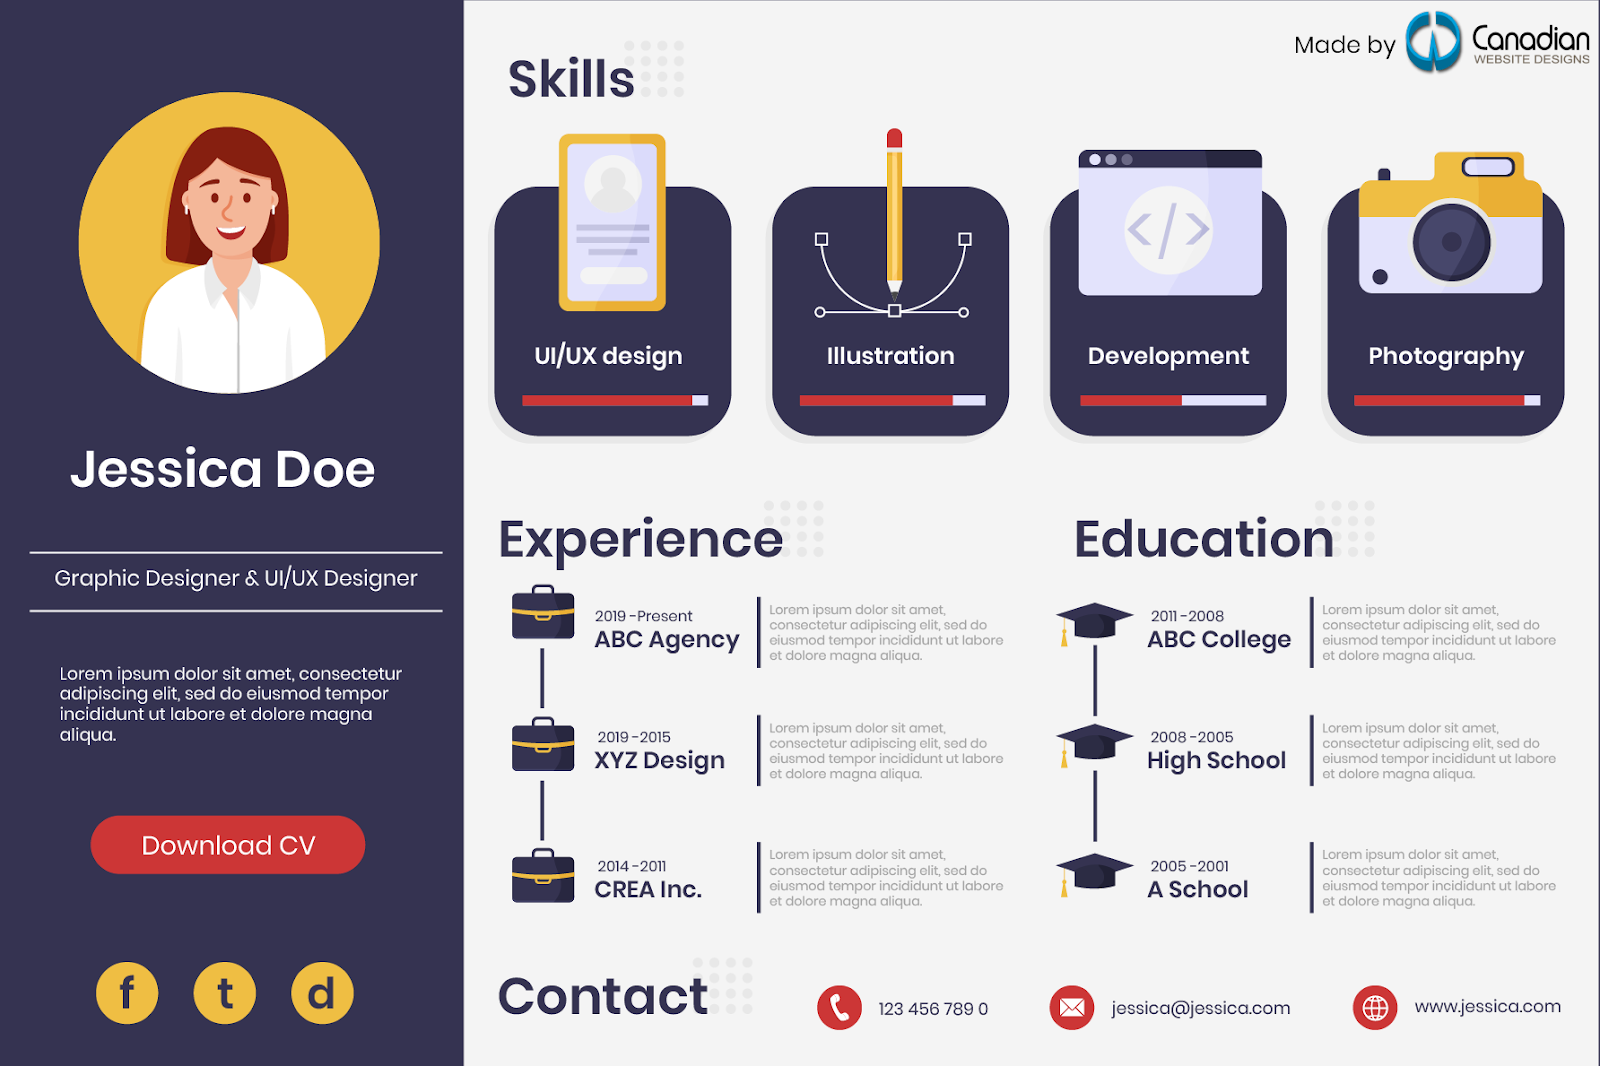
Visual Resume Infographic Presentation
Thinking about innovative and unique resume creations. Well, this is the exact answer. The visual resume infographic presentation is often used by graphic designers and digital artists for presenting their skills, interests, and factual information about them. Sometimes they create a colorful avatar that looks exactly similar to them and uses it as their profile display.
Final Thoughts
Using any infographics can enhance the reading comprehension of learners because of its engaging nature of the content. Adding infographics to learning materials or online posting purposes will surely attract the attention of the readers.
Looking for an Infographic Creator?
The Canadian Web Design’s excellent graphic artist has provided innovative works for our local and international clients. We design business cards and other promotional materials to help you expand your business awareness. Call 647-492-5513 or email sales@canadianwebdesigns.ca You can also visit our main office at 202-5 Cherrycrest Drive, 202-5 Cherrycrest Drive, Brampton, ON L6P 3W4, Canada.
In This Article
- What is Infographics?
- Purpose of Infographics
- Different Types of Infographics
- Statistical Infographic Presentation
- Informational Infographic Presentation
- Timeline Infographic Presentation
- Process Infographic Presentation
- Geographic Infographic Presentation
- Anatomical Infographic Presentation
- Comparison Infographic Presentation
- Hierarchical Infographic Presentation
- List Infographic Presentation
- Visual Resume Infographic Presentation
- Final Thoughts
- Looking for an Infographic Creator?